Advanced Troubleshooting
If you get here, it probably mean
-
That you're either curious about WSL internal tools, which is cool, please read on.
-
Or, that Basic Troubleshooting did not help you solve the issue you're having, which is, generally speaking, not a good sign. WordPress Social Login has been built with reliability and portability in mind, but every now and then a user with an esoteric WordPress environment will come up with an unforeseeable issue, which is also to be expected.
To help with these cases, WordPress Social Login provides two internal tools to troubleshoot complex issues.
Debug Mode
The Debug mode is an internal development tool built to track every action made by WSL during the authentication proces, which can be useful when debugging this plugin but note that it is highly technical and not documented.
To enable this feature, go to the Tools tab, then the Debug mode section.
When Debug mode is enabled and set to Log actions in a file, WSL will attempt to generate its log files under /wp-content/uploads/wordpress-social-login .
When Debug mode is enabled and set to Log actions to databse, will create a new log table wslwatchdog and insert these actions names and arguments.
It's recommended to keep the Debug Mode Disabled as will store unnecessary data on your web server and might add to loading time.
Please, don't use Debug mode, unless:
- You are studying how WSL works
- You are implementing new things into WSL
- You have an issue and you really really want WSL to work
Development mode
In WSL 2.2, we have entirely reworked the Development mode and now it display a nice and comprehensive debugging area on the footer of admin interfaces.
The new Development mode was highly inspired by the Query Monitor Plugin — A must have for Wordpress plugins developers.
To enable this feature, go to the Tools tab, then the Development Mode section.
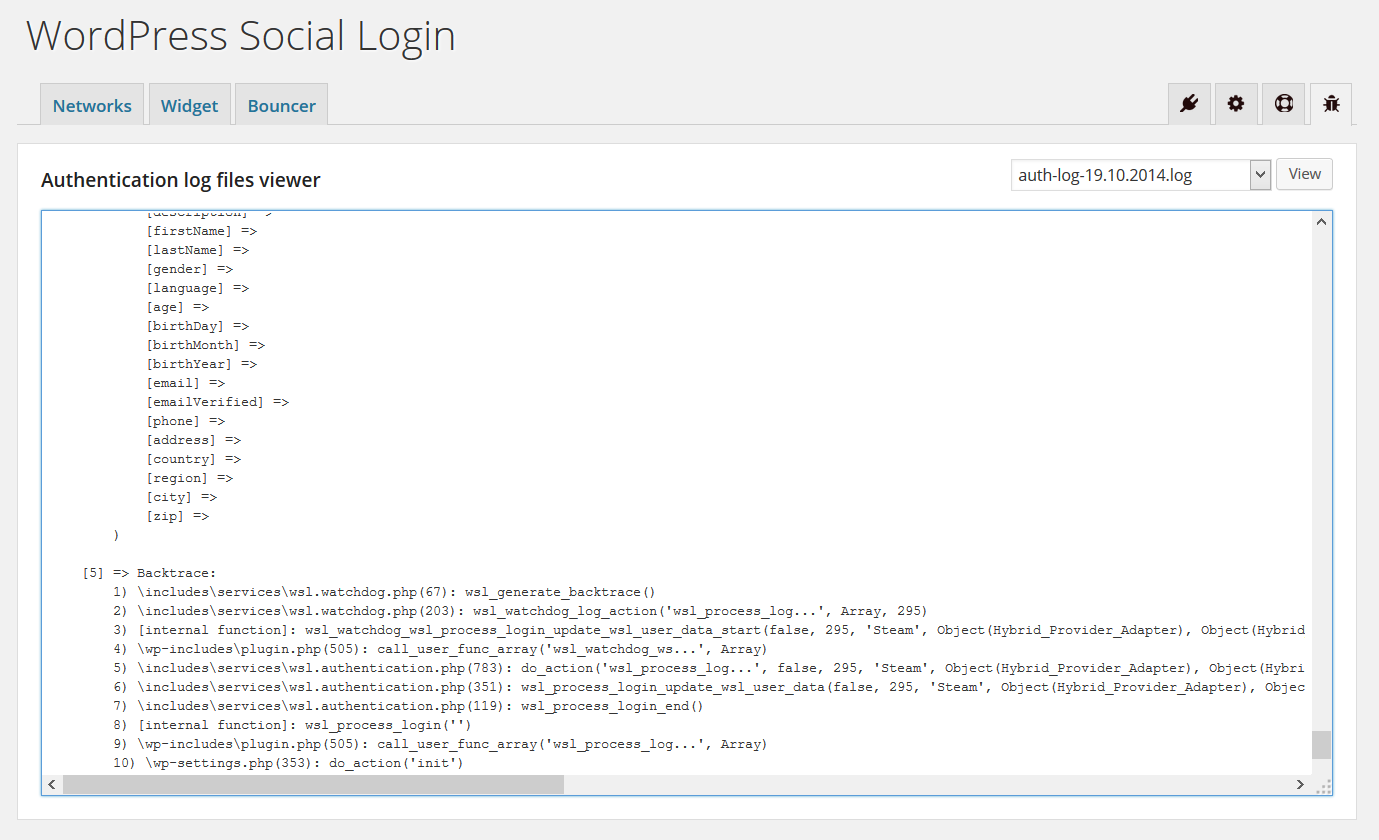
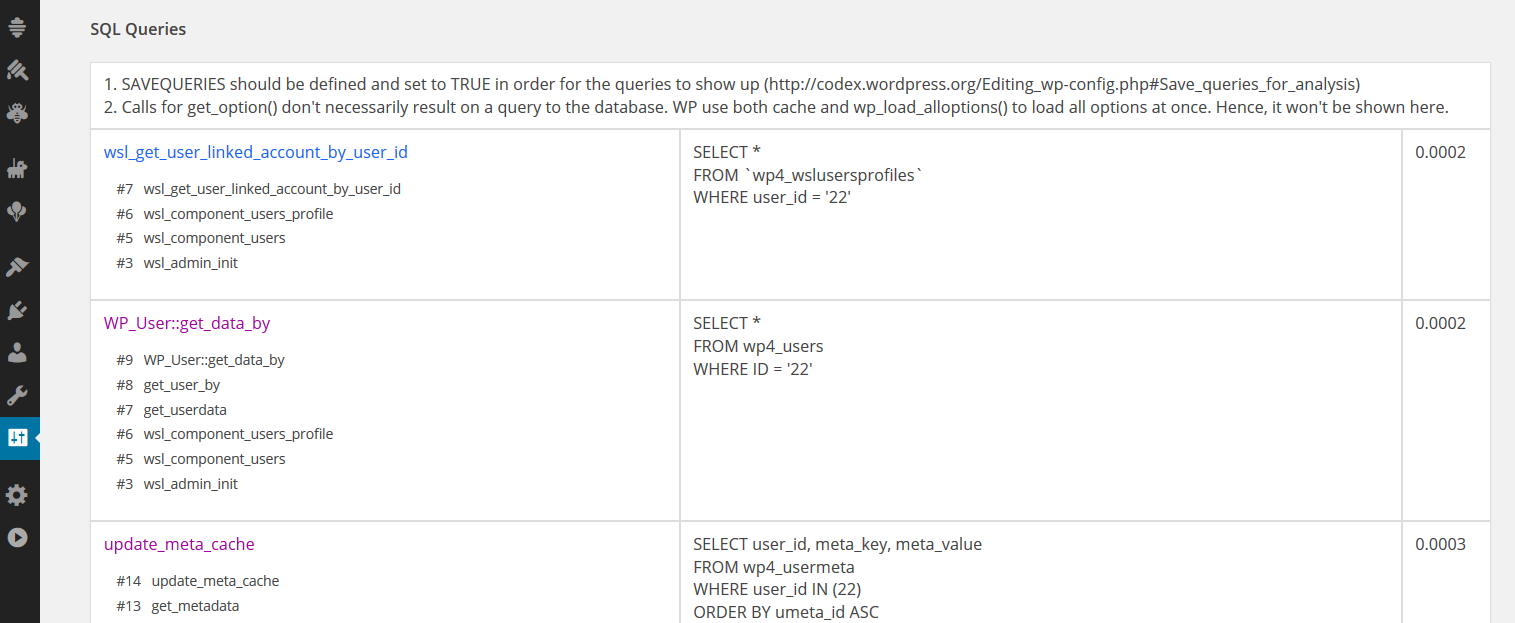
When Development Mode is enabled, WSL will display a debugging area on the footer of admin interfaces. Development Mode will also try generate and display a technical reports when something goes wrong. This report can help you figure out the root of the issues you may runs into.
Please, do not enable Development Mode, unless you are a developer or you have basic PHP knowledge.
For security reasons, Development Mode will auto switch to Disabled each time the plugin is reactivated.
It's highly recommended to keep the Development Mode Disabled on production as it would be a security risk otherwise.
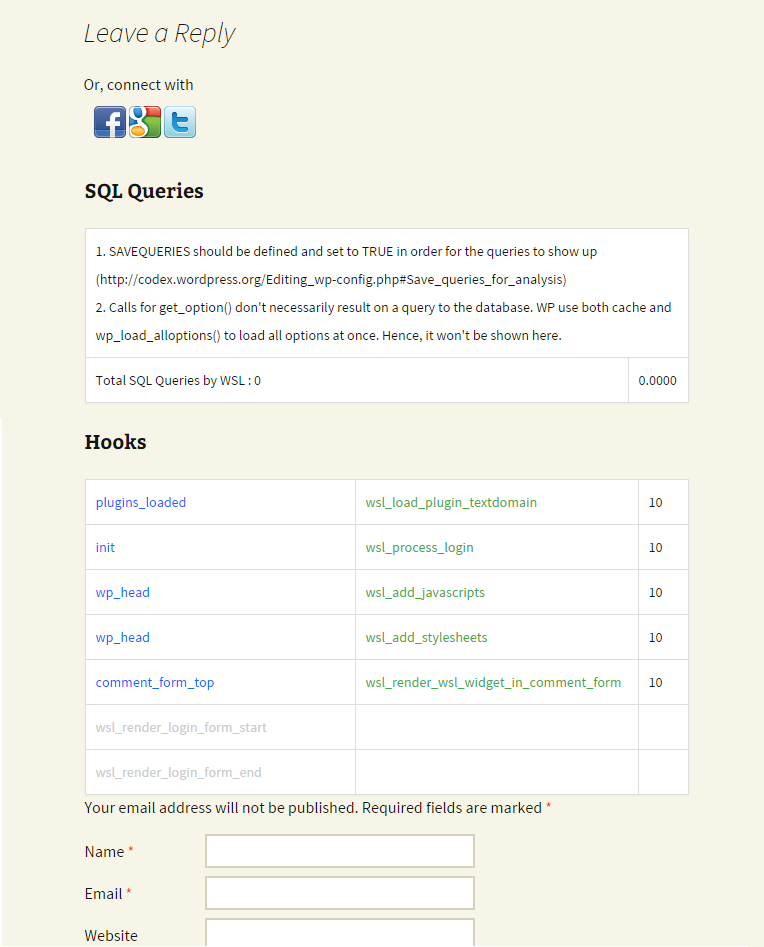
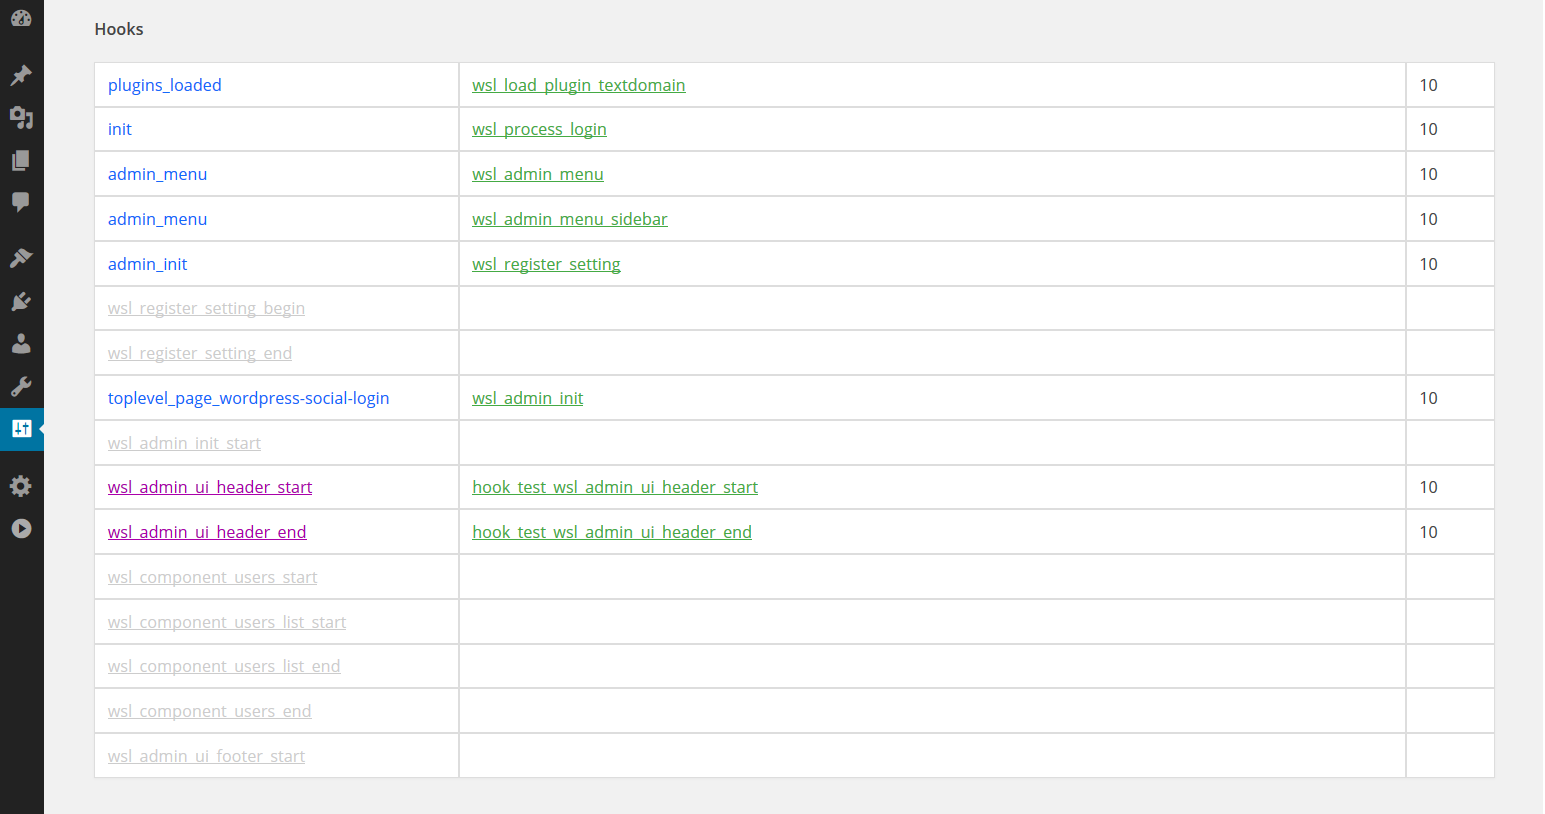
The bottom section of the debugging area will show the hooks fired on the current page, along with the hooked actions:
- Blue: External hooks and functions fired by WSL.
- Purple: WSL hooks fired by external functions.
- Green: Fired WSL hooks.
- Gray: Registered but unused WSL hooks.
If you are in development mode, and you want do display this debugging area somewhere else on your website, you directly call this function :
<?php wsl_display_dev_mode_debugging_area(); ?>